

Recently, we announced some enhancements to our standard reports designed to let you tailor the data the way you want to see it. With the new and improved reports, you have a fresh look and feel and a whole host of new filtering and sorting options to make running reports easier and more efficient than ever. You can get all your data, all the time, right from DigitalChalk. No need to spend your valuable time creating, sorting, and editing long, complicated documents to get the data you need.
DigitalChalk reports provide learner data and analytics that help you better understand and manage your employee training program or your online training business. If you train your employees, reports track learner behavior to assist you in determining the effectiveness of your training program. If you run an online training business, reports help you track your top selling courses and make better strategic business decisions.
In this post, we’re going to demonstrate how to access and run reports using the updated setup. Follow these steps to run reports in DigitalChalk with the new look and feel:
1. Click the “Administration” tab.

2. Click “Reports” in the side menu.

3. View basic reporting data on the reports dashboard.

4. Click on the report you want to run. For our example, we’ll use the “Student Registration Report.”
*Note: The list of reports available to you may vary based on your DigitalChalk plan.

5. Select a date range, toggle “Exclude Deleted Offerings” and “Exclude Deleted Users” on or off, and select your reporting categories by switching them between the “Available” and “Include” columns. When you are finished, click “Run Report.”

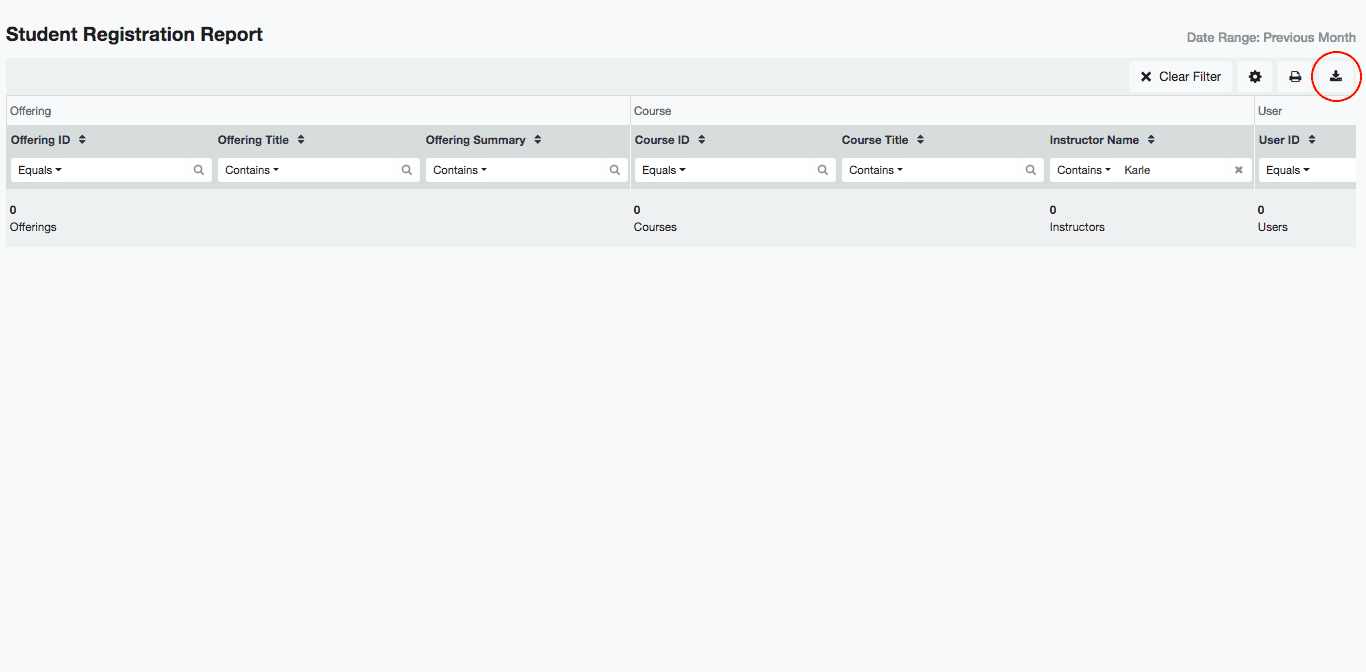
6. On the displayed report, click the drop-down for a field to filter the data, and select the category corresponding to the filter you want to apply. Type the appropriate value in the filter field and type “Enter” or “Return” on your keyboard to apply the filter.

7. Though you can customize any report to show the data exactly as you want it entirely within DigitalChalk, you can also download a CSV or HTML printer-friendly version of your report if you need to.
Now you have everything you need to run enhanced reports in DigitalChalk. We made these updates with you in mind, to streamline the reporting process, so you can get your reporting data when you need and perfectly tailored to your online business or training program needs.
Go ahead and try the enhanced reports for yourself, and feel free to let us know what you think! In the meantime, watch this instructional video for a visual, real-time tutorial.
0 Comments