eLearning infographics are everywhere these days, and many students prefer them rather than the traditional course materials. Readers can quickly scan the data and research and gain a broad understanding of the material within just a few seconds. But before you start transitioning your course materials into eLearning infographics, what are the pros and cons you may need to consider? We’ve listed them out for you.

Pros
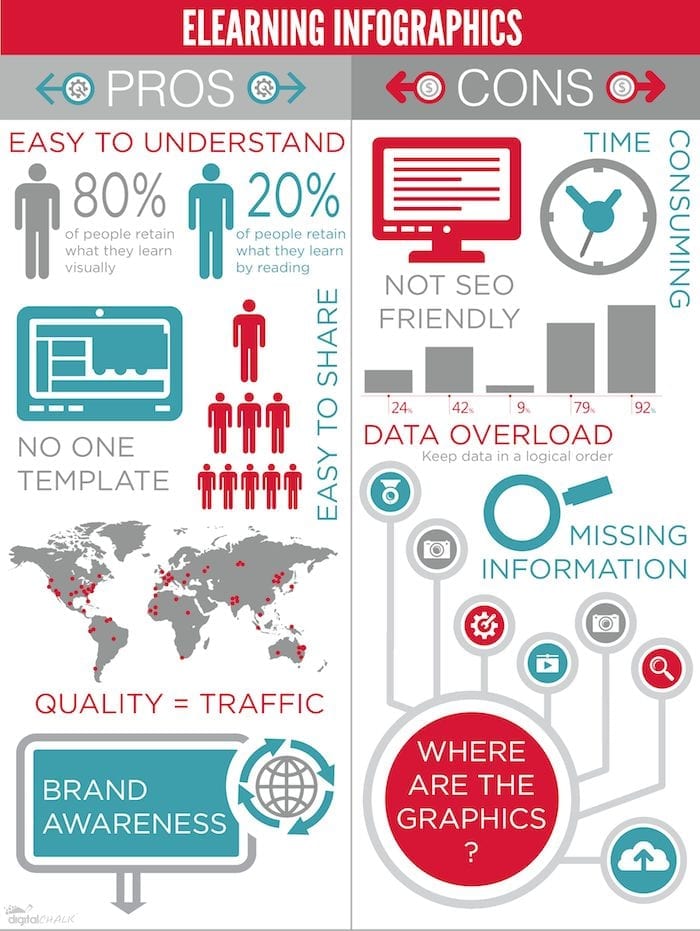
- Easy to understand. They take paragraphs of information and translate them into graphics using minimal words to explain them. People retain approximately 83% of what they learn visually as opposed to 20% retained by reading.
- Easy to share. Infographics will catch the eyes of your readers and can easily go viral once they begin to share it.
- You don’t need to follow a template. Creating an infographic has plenty of freedom that comes with it – you can change the colors, format, and style.
- Brand acknowledgment. When you create an infographic, embed your logo within it. Once your readers share it, it’s like free advertising.
- Quality = traffic. Infographics can be a step-by-step guide, a resource list, or a list of statistics. High quality content infographics convey your industry expertise, which will help validate your business and increase traffic.
Cons
- Time consuming. Quality infographics are not easy to make and require a time commitment. You can’t just research and be done; you have to design the layout and graphics as well.
- Not SEO-friendly. Search engines don’t recognize infographics, and therefore, cannot be indexed. Instead, index the page where your infographic is hosted and include text and keywords underneath the infographic.
- Missing information. Infographics don’t always give a full story. There isn’t room for paragraphs of information, so you’re getting the simplified version.
- Data Overload. You don’t want to overwhelm your readers with statistics and data. Your infographic needs to have a headline and your data results need to be in a logical order. Be sure your readers can understand what the numbers mean.
- Where are the graphics? Remember, an infographic has GRAPHICS. Don’t just use text to describe a step-by-step process or a how-to guide. Include graphics.